Pagespeed optimization with precision monitoring

Collect metrics
A fast website is crucial for effective SEO optimization, and the time a server takes to generate the first byte of a page is central to this effort. This so-called "time to first byte" is a key metric for overall website performance.
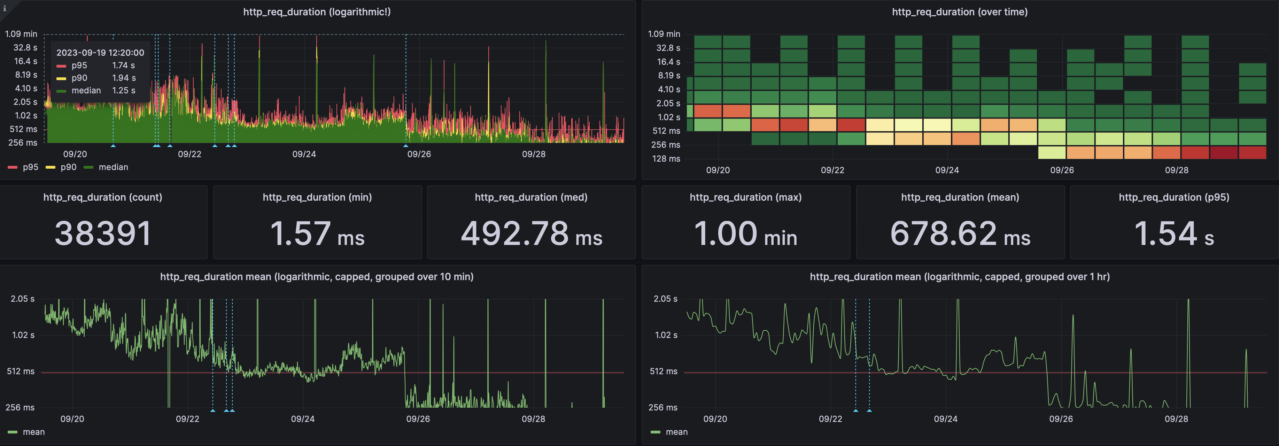
Recently, I set up a monitoring system for a client actively working on improving pagespeed. The system tracks specific essential URLs and measures the time to first byte. During various development iterations and the addition of new features, the pages had slowed down in terms of this crucial metric.
“ Time to first byte is now within our KPI for PageSpeed ”
Using monitoring, including so-called 'smoke tests,' we can keep an eye on the speed of the pages both in the short and long term. By adding annotations to the timeline, such as when rolling out new features, implementing optimizations, and making changes to the infrastructure, we can precisely see the impact of these events on page performance.
Thanks to this approach, we significantly reduced the time to first byte, even below the set KPI level. For the monitoring stack, I set up an AWS instance with k6, InfluxDB, and Grafana. K6 allows for load and stress tests, InfluxDB efficiently stores the results, and Grafana provides a visual representation of the results while allowing for annotations.
The implementation of this stack was remarkably straightforward; I used Docker containers and a separate EBS volume to store the data. The costs for this monitoring are minimal, especially considering how easy it has become to perform precise optimizations.
See also..
Skills
- Grafana
- K6
- InfluxDB
- Docker
- NodeJs
- AWS EC2
- AWS EBS


